The Kennel Club is aware of some concerns amongst the agility community surrounding the updated course time matrix that was released earlier this year. The Kennel Club is future focused and does respect the concerns raised. The below information has been provided to give some reassurance to the community that the course time matrix has been implemented with the best of intentions.
- Lack of Transparency and Consultation
Data
Some competitors have raised concerns that the dataset has not been published or explained and may be incomplete (e.g. missing data from ASO, FPP, Agility Aid), and that the method for calculating averages (mean, median, mode) is unclear.
The Activities Judges Sub-Group approached two show processors to seek support by providing data with the intention of updating the course time matrix. The information requested was for data to be provided from Kennel Club shows (regardless of licence type) and that the data should include: the type of class (agility or jumping), height category, grade, course length and the dog’s time.
Showtime Online and Agility Plaza kindly provided the Kennel Club with a significant amount of data, totalling over 367,500 rows, with each row representing an individual run by a dog and handler in a competition.
Whilst it is acknowledged that there are, and have previously been, other show processors, it is fair to state that Showtime Online and Agility Plaza cover the vast majority of Kennel Club shows across the United Kingdom. There were no exclusions applied to the type or location of show.
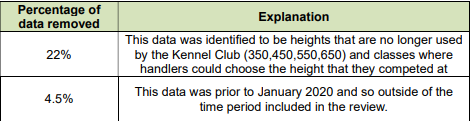
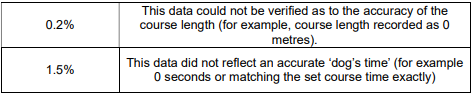
Upon receipt of the large volume of data, it was clear that there were some inconsistencies recorded and this would impact the calculations for the revision. The table below shows the reasoning for removal of certain data which resulted in over 264,000 rows of data that could be utilised in order to revise the course time matrix.
It is acknowledged that some competitors had concerns that the data was favouring a particular grade and / or height. The below table provides a breakdown of the data for each height and each grade.
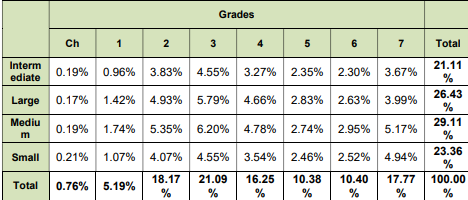
This data has therefore covered all grades and heights across a variety of shows of all sizes, on a variety of surfaces and weather conditions.
Methodology
This is the first time that the Kennel Club has been able to analyse real-life data from dogs that have actively competed at Kennel Club shows across the United Kingdom. The previous course time matrix had remained unchanged for 10 years, was from a very limited data set and was only split between agility and jumping. Whilst each height and grade were accounted for on the previous matrix, there was a wide variation in course time that the judge could choose between. The new course time matrix has been expanded to provide finer details, with a matrix provided for agility and for jumping, for each height and with a much clearer split provided on the grades.
Old Course Time Matrix
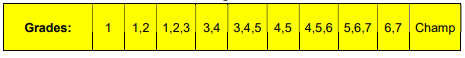
New Course Time Matrix for each height:
Furthermore, the previous course time matrix provided course lengths varying between 95 metres and 240 metres, it is recognised that agility has progressed and diversified over the years, in relation to course design and indeed course lengths. It is for this reason that the new course time matrix provides course lengths between 95 metres and 250 metres, providing this in 2 metre increments from 100 metres – again offering much more detail when compared with the old course time matrix.
The refined dataset ranged between January 2020 and April 2025. Each dataset then had the average metres per second calculated, by dividing the recorded course length by the recorded dog’s time. For each height and grade, the mean average was calculated to provide the metres per second that dogs across the United Kingdom have actively achieved in competition. To some extent this accounts for the real-world variables as mentioned previously, weather, ground conditions and course complexity. It was very clear from the data gathered, that intermediate dogs were, faster than the large dogs.
With an average metres per second value determined for each height and individual grade, the next step was to generate realistic course times. This was done by:
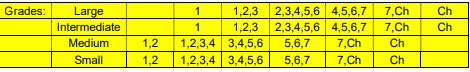
- Averaging the metres per second for the relevant grades in each group
- Dividing each standard course length (in metres) by the average metres per second to generate the course time.
In most cases this provided a course time, with multiple decimal places. To treat all grades and heights fairly, regardless of the decimal value, this was rounded up to the nearest whole second.
Although real-life data from dogs competing across the United Kingdom was used, the Kennel Club recognised that the course times provided by the above calculation may still not fully account for the ever-changing weather conditions or ground conditions. It was also recognised that many competitors utilise the Agility Warrant scheme to claim agility warrant status and begin their grade progression. In the interests of treating all dogs and grades equally and fairly, the decision was made to add an additional 10 seconds onto all calculations, after the rounding up mentioned above.
Following feedback from the community, other potential adjustments were explored, including applying a percentage increase to course times and decreasing the metres-per-second (m/s) speed. However, when modelled against the same dataset, both of these approaches produced overall course times that were, on average, lower than those achieved using the additional 10 seconds. As a result, it was concluded that the 10-second adjustment remained the most appropriate and equitable option, offering a more generous allowance than the alternative methods considered.
Testing
The first phase of testing the course time matrix after creation, was to significantly analyse, from the data set – how many dogs from the data used would be outside of the course time using the revised matrix.
For each individual row, the course time was set, using the revised matrix, based upon the course length provided for the dog and handler’s competitive run. However, it was noted that in some instances on the new course time matrix, that there was now a choice of course times depending on the grade. It was decided to use the lowest possible course time that could be selected – for the appropriate grade, height and course length. As the dog’s recorded time was available for each row, it could be calculated as to whether any time faults would be incurred using the revised matrix.
The below table shows the percentages affected by the revised course time matrix as well as a corresponding pie chart.
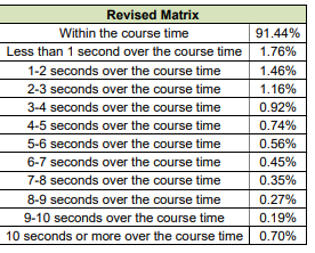
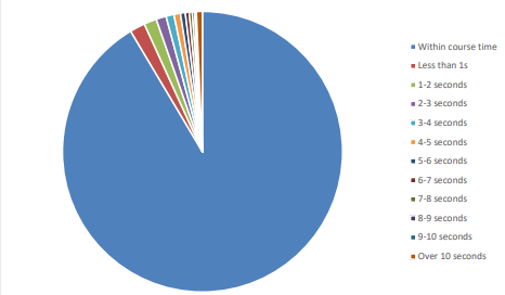
A total of 8.56% of the data set would have been outside the revised course time matrix, whilst 91.44% remained within the course time using the revised course time matrix, with the lowest possible time given.
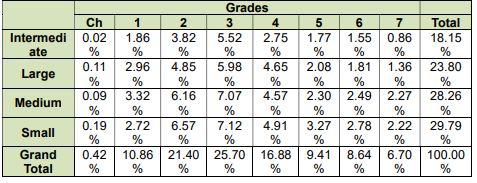
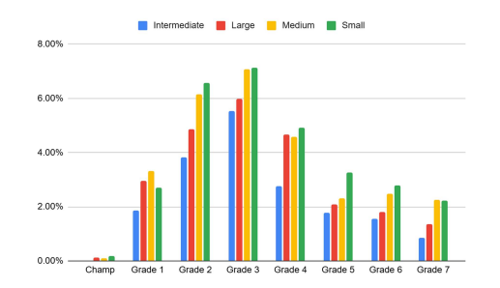
It was then important to analyse, whether those that would be affected by the revised course time matrix, were in a particular grade and / or height. The below table and graph shows a breakdown of the rows of data that were identified to exceed the revised course time matrix, split between each grade and height.
Satisfied with the analysis carried out as explained above, it was then key to trial this in live judging / competition scenarios. The Activities Judges Sub Group were approved by the Kennel Club to seek the assistance of the accredited judges’ trainers for agility. The sub group provided the revised course time matrix to the judges’ trainers and requested that they use the matrix in any future judging appointments and report back with any concerns or issues.
Having successfully trialled the revised course time matrix, the accredited judges’ trainers for agility reported no significant concerns with the revised course time matrix.
The revised course time matrix was finalised and provided to the Agility Liaison Council to note that a revised course time matrix had been created and would be implemented via the Code of Best Practice for agility judges.
2. Inclusivity, Fairness, and Breed Diversity