
During 2004, The Kennel Club and the British Small Animal Veterinary Association scientific committee joined forces with scientists in the Epidemiology Unit at the Animal Health Trust to carry out a nationwide survey of UK purebred dogs and, with the help of owners, to identify important health conditions in UK dog breeds. The Kennel Club Charitable Trust committed substantial funds to support this project, which could only succeed with the help of owners.
How was the survey carried out?
Questionnaires were sent to the numerically largest club of each breed, and secretaries were asked to send them out to their members. Only the largest club of each breed was selected to try and avoid duplication, and also to limit the vast number, and therefore cost, of the 70,000 forms needed.
What questions were asked?
The questionnaire was divided in different sections, concentrating on different types of information. There were questions on the health of the owners' dogs, breeding, causes of death and birth defects in any puppies.
Giving feedback to breed clubs
Breed clubs have received detailed feedback on the results of this survey, where the breed response rate was at least 15%, which should greatly assist with the recognition and control of important conditions in specific breeds. Data gathered from this survey provides baseline information against which the success of future control schemes can be measured.
Please note that reports may not be available for breeds which had a response rate of 15% or less, and/or had only 50 completed questionnaires or less.
Results
For results for individual breeds please email The Kennel Club health team who will be able to provide you with the results you require.
Warning
Mortality data
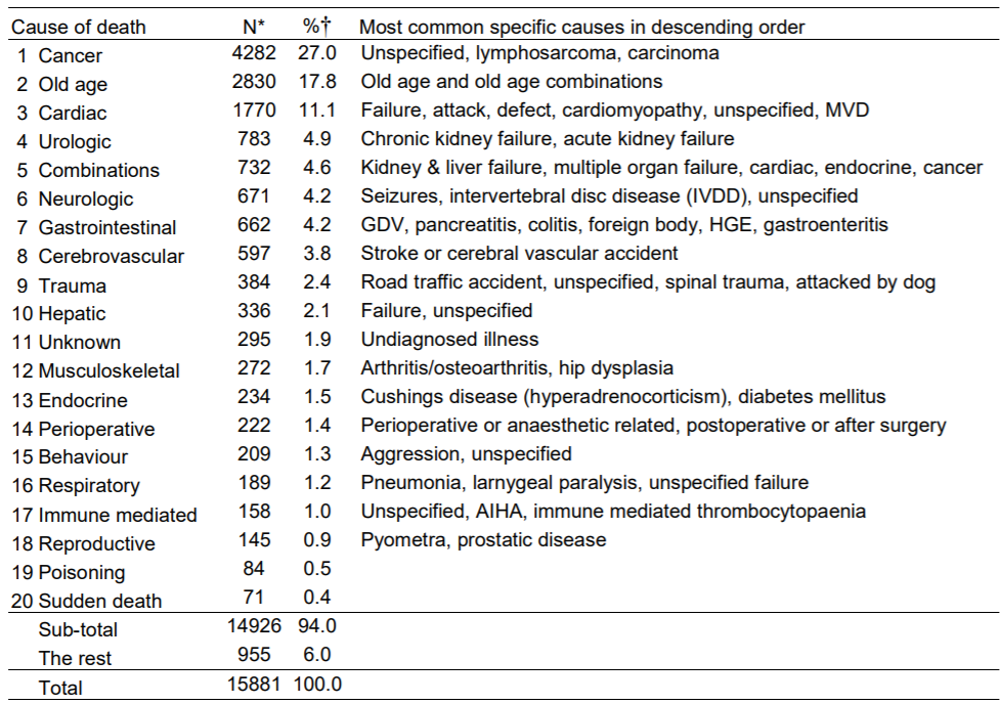
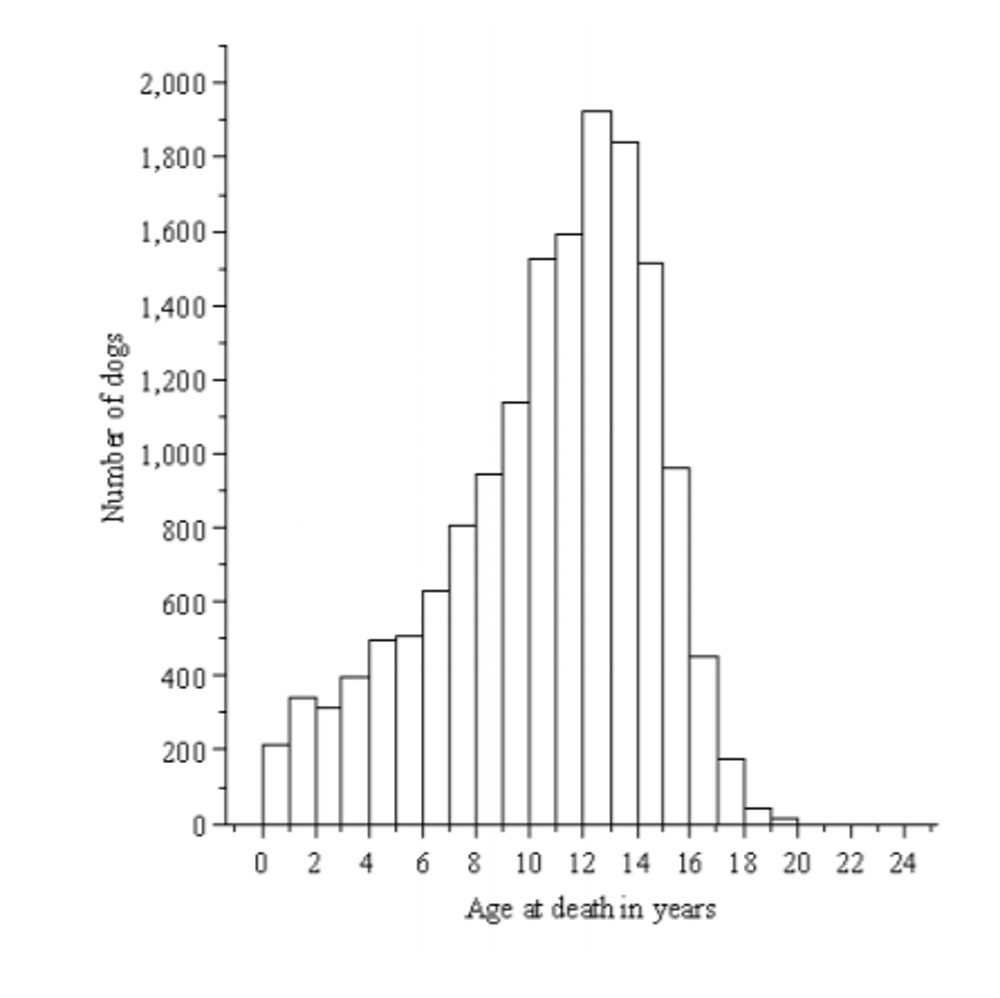
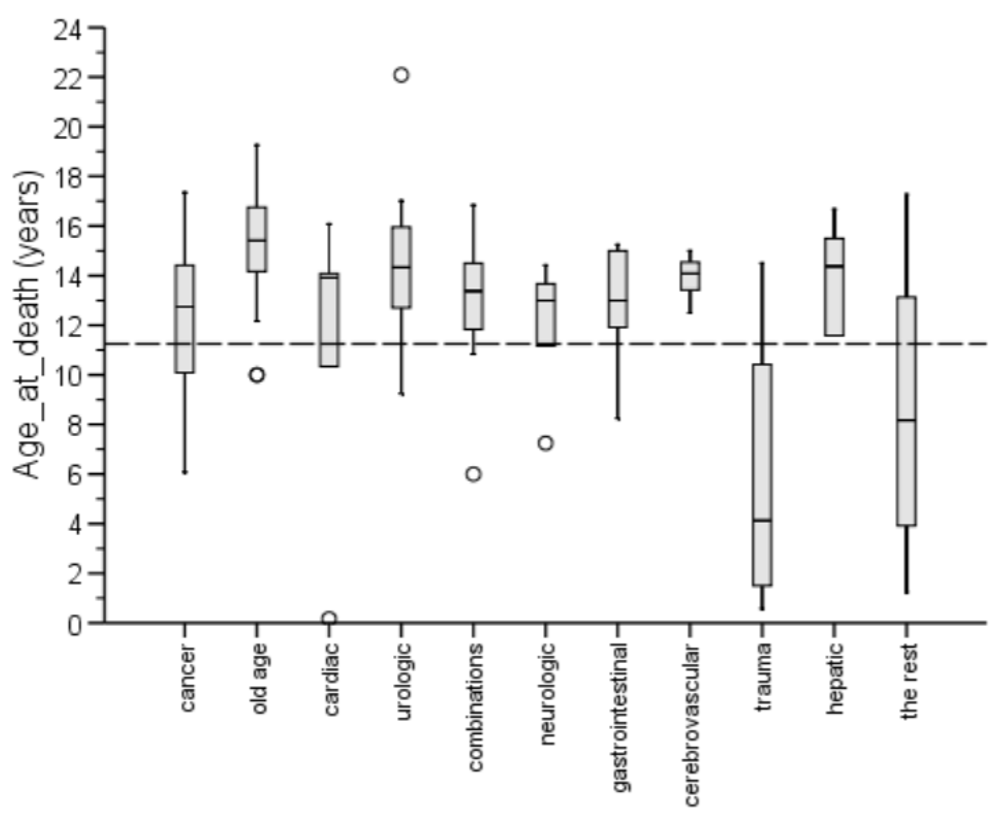
Only 20% of dogs remained alive at 14 years of age and this had fallen to <10% by 15 years (Figure 1). Table 1 shows the twenty most common causes of death. Age at death is presented for the 10 most common causes of death (Figure 2).
Table 1. Cause of death by organ system/category for all breeds
Morbidity data
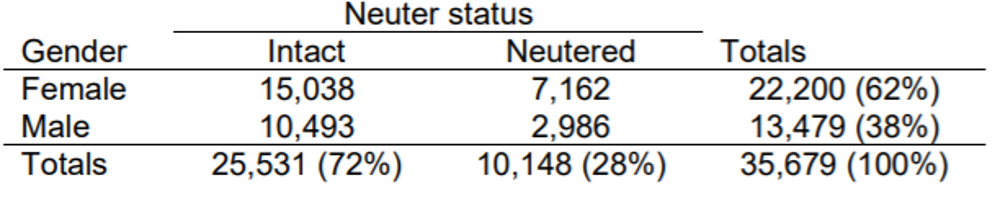
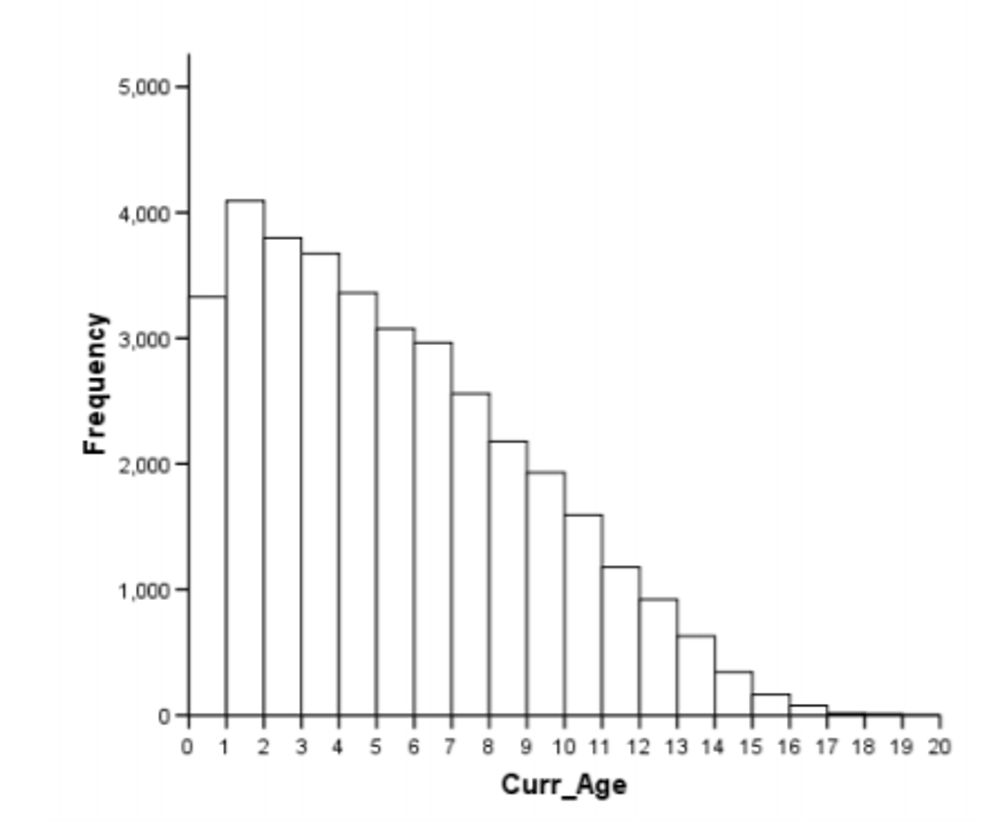
The median current age of all healthy dogs with a reported age (N=22,467) was 3 years and 10 months (min=1 month, max=19 years). The distribution of gender and neuter status is shown in
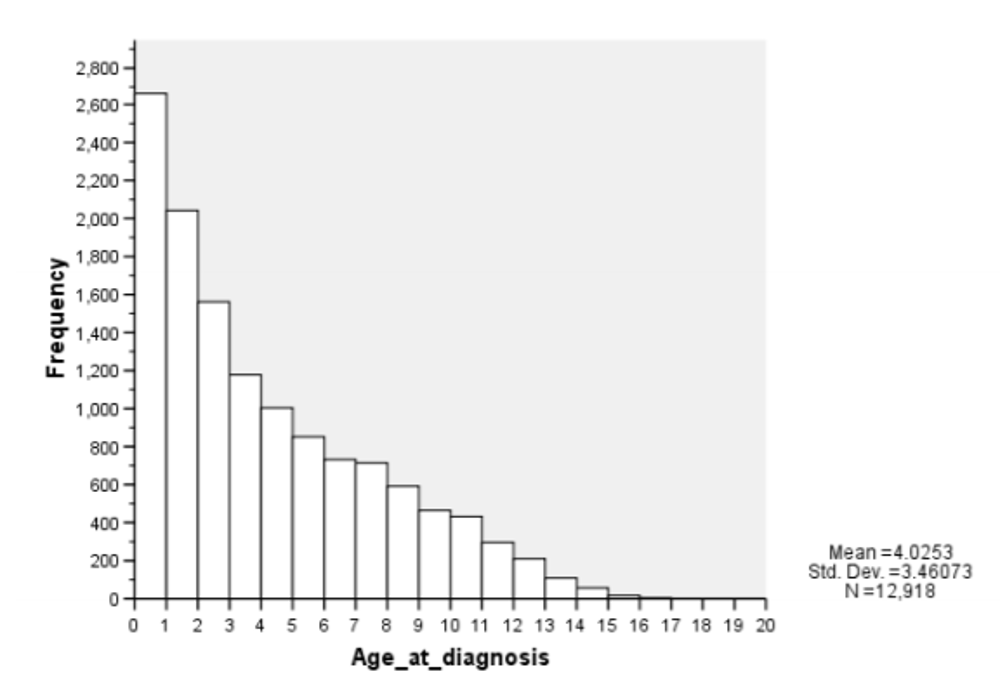
Table 2. The median current age of all dogs with one or more disease conditions and a reported age (N=13,432) was 6 years and 9 months (min=1month, max=18 years and 11 months). The median age at diagnosis for all disease occurrences with a reported age at diagnosis (N=21,551) was 3 years and 4 months (min=1 month, max=16 years and 11 months, Figure 4).
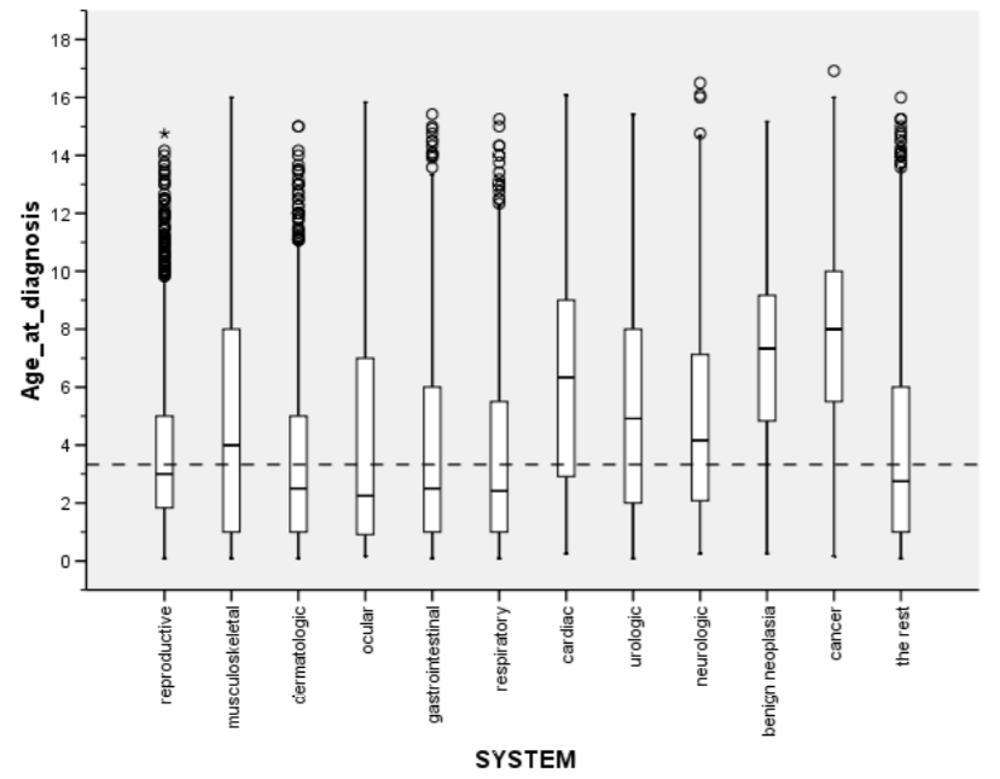
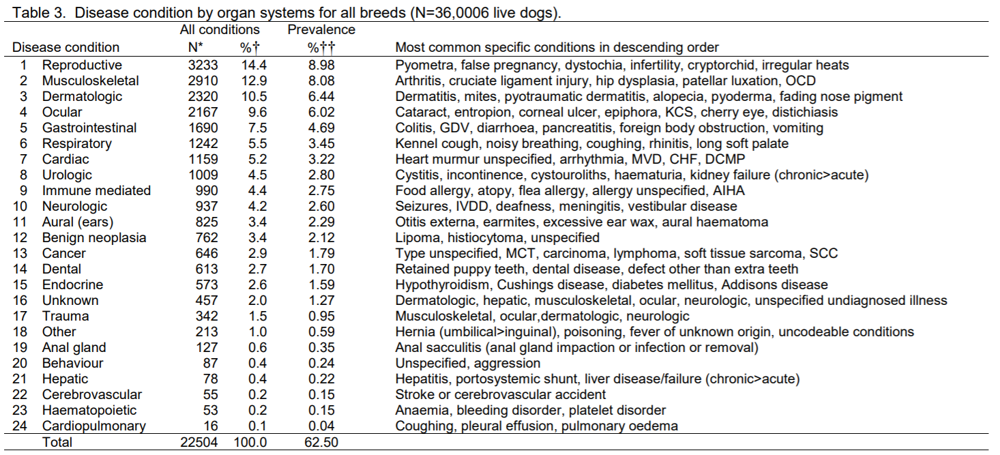
Table 3 shows the frequency of occurrence of all reported disease conditions. Age at diagnosis is presented for the most common disease conditions (Figure 5).
Table 2. Distribution of gender and neuter status for dogs with reported gender and neuter status.
Notes for individual breed reports
Breed-specific reports have been prepared for those breeds with response rates ≥15%regard less of the total number of completed questionnaires returned.
Mortality or cause of death data are reported as breed-specific proportional mortalities. Breed-specific proportional mortality is reported as the number of deaths due to a specific cause affecting a specific organ system divided by the total number of deaths for the breed in the past ten years reported in the survey.
Table 1:
N=number of deaths due to a specific cause for the breed % = proportional mortality as N/total number of deaths for the breed in the past ten years
For Figure 2:
Box and whisker plot of age at death in years for the most common causes of death in the breed (N=total number of deaths in the breed). The dashed line (–––) is the overall median age at death for all dogs in the survey and the dotted line (----) is the overall median age of death for the breed.
The solid line within each grey box represents the median age at death from the condition. The box represents 50% of the dogs and the whiskers represent 95% of the dogs for each condition. The circles () represent possible outliers and the asterisks () represent extreme outliers.
Morbidity or frequency of disease occurrence data are reported as breed-specific proportional morbidities.
Breed-specific proportional morbidity is reported as the number of cases of a specific disease condition divided by the total number of diseased dogs for the breed.
For Table 3:
N = number of cases of a specific disease for the breed
% = proportional morbidity as N/total number of dogs with disease conditions for the breed
For Figure 5:
Box and whisker plot of age at diagnosis in years for the most common disease conditions in descending order for the breed (N=total number of dogs with n conditions and age at diagnosis reported. The dashed line (–––) is the overall median age at diagnosis for all dogs in the survey and the dotted line (----) is the overall median age at diagnosis for the breed. The solid line within each grey box represents the median age at diagnosis from the condition. The box represents 50%
of the dogs and the whiskers represent 95% of the dogs for each condition. The circles () represent possible outliers and the asterisks () represent extreme outliers.
Medians with minimum and maximum values are reported throughout the reports as these are the most appropriate statistics for skewed distributions such as age at death. When data are not normally distributed, the median value is a more appropriate measure of the central tendency or average for the data. The median value represents the middle value, below which lie 50% of the values and above which lie 50% of the values.